I-Maps

Solutions

I-Maps products, services, and offerings

Investment Visualisations

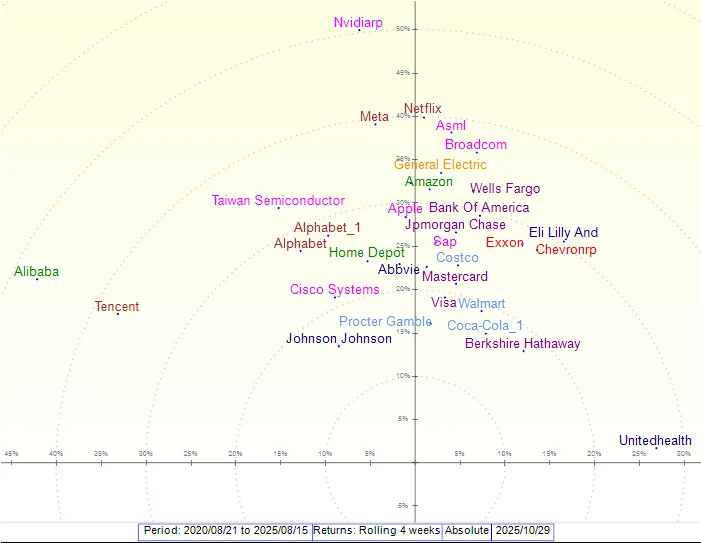
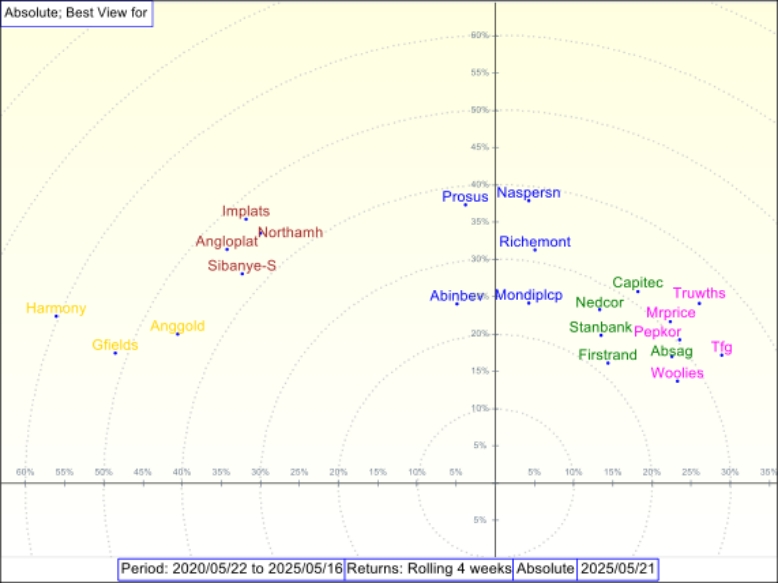
I-Maps uses intuitive investment maps to show volatility and correlation together, helping investment professionals understand the structure of the investment landscape at a glance. By combining these fundamentals into a single view, the map provides immediate clarity on how assets behave, how closely they move together, and where risk is concentrated within the broader universe.

Instantly grasp the investment landscape through an intuitive map. Two fundamentals of investing — volatility and correlation — are shown together on a single visual. Volatility is represented by a point’s distance from the origin, and correlation by the angle between two points. The maps’ clarity makes them valuable to newcomers, experienced professionals, and clients alike.

Customise the map to display your chosen investment universe, from local to global markets. Allowing teams to analyse portfolios within the correct context, switch between different universes as needed, and compare positioning across regions, mandates, or peer groups. By adjusting the universe view, investment teams can build insight faster without rebuilding analysis from scratch.

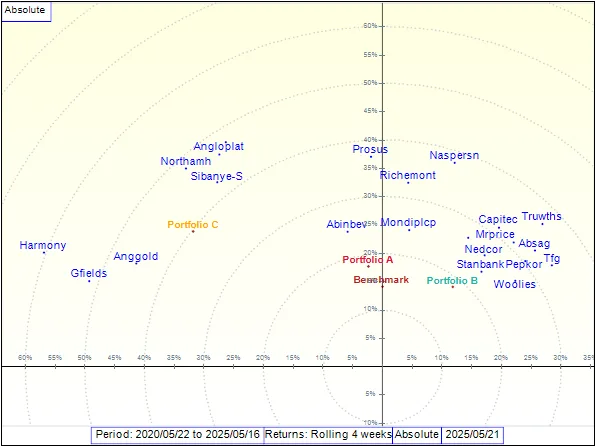
See where your portfolio sits within the investment universe alongside peers and benchmarks. This makes it easier to interpret portfolio structure and understand whether positioning is defensive or aggressive relative to the opportunity set. A single glance can provide clarity on exposure patterns, risk concentration, and how portfolio decisions compare to peer portfolios.

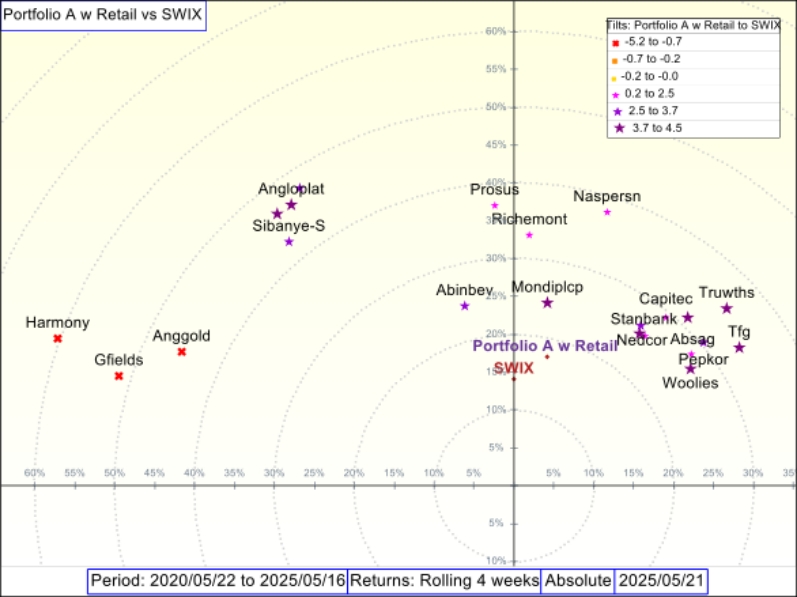
Re-centre the investment universe around any chosen benchmark to view positioning relative to it. This perspective is particularly useful when assessing active risk, as it allows you to interpret portfolio behaviour against a reference point rather than in isolation. By shifting the view, teams can better understand active decisions, evaluate differences, and communicate positioning more clearly.

Identify areas of risk concentration and diversification opportunities with clear visual indicators for overweights and underweights relative to a chosen benchmark. Active positions become easy to interpret, supporting faster insight into where risk is building, which exposures are driving differences, and where a portfolio may be unintentionally crowded.

Analytics and Charts

Explore portfolio construction in greater depth with comprehensive
risk analytics, including beta, tracking error, volatility, dispersion,
factor sensitivity, and custom measures such as valuation or ESG scores.
The analytics layer supports rigorous portfolio review by pairing the map with the metrics required for governance, risk monitoring, and investment decision-making.

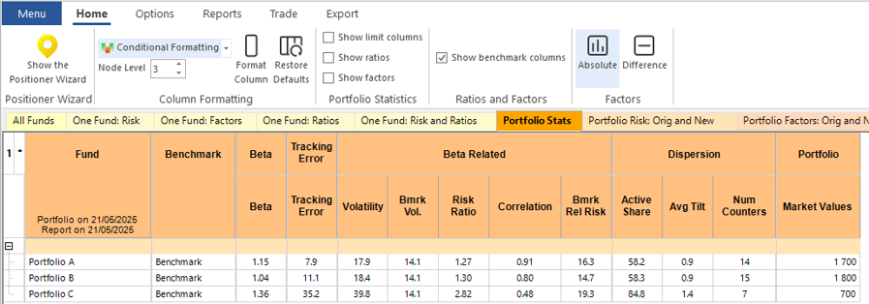
Explore portfolio construction in greater depth with detailed statistics and charts. Alongside the maps,
I-Maps provides a wide range of risk metrics — including beta, tracking error, volatility, dispersion, factor sensitivity, and more. You can also display custom measures such as PEs, ranks, or ESG scores, giving you complete flexibility in how you view portfolio risk.

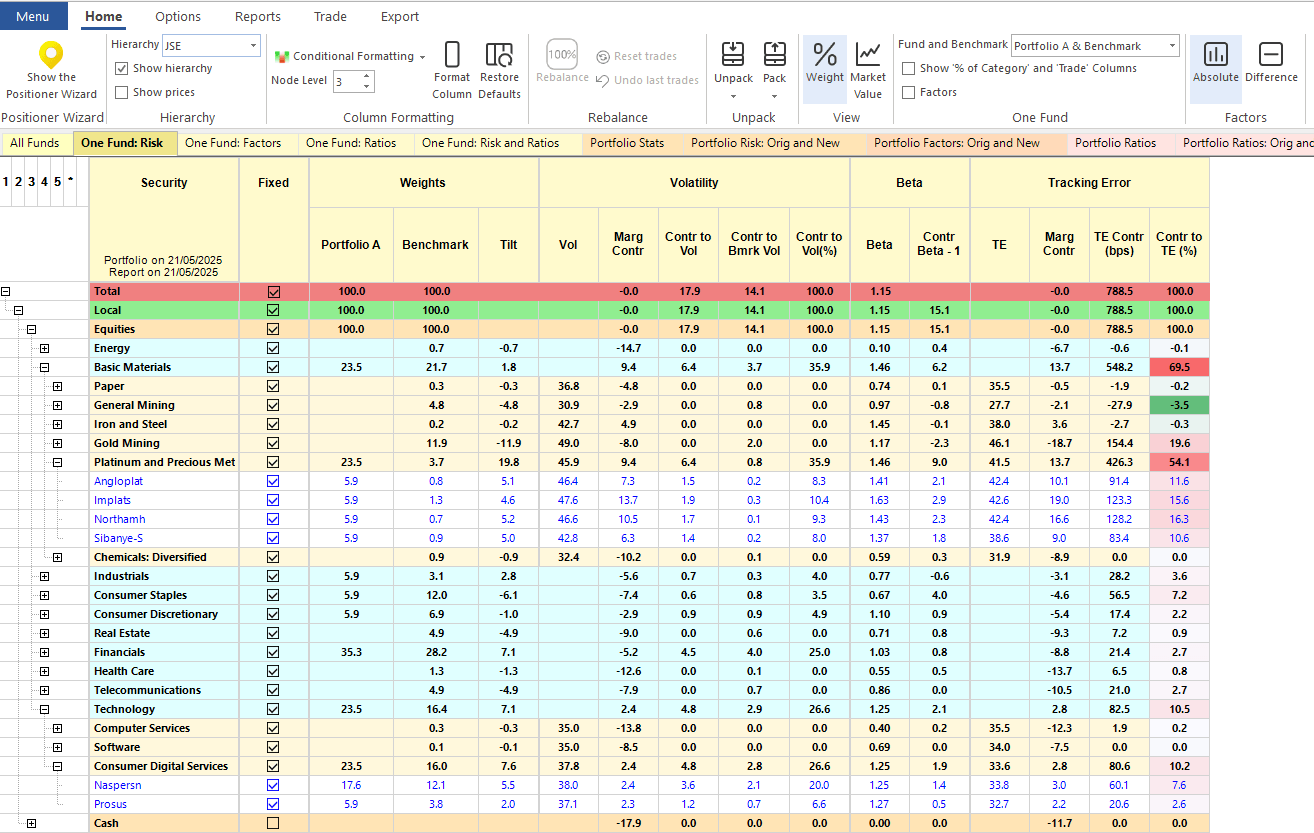
Understand how each security and sector contributes to overall portfolio risk. By viewing risk at both portfolio and holding level, teams can pinpoint which positions drive tracking error and volatility, identify sector concentration issues, and understand how changes in allocations influence the overall risk profile.

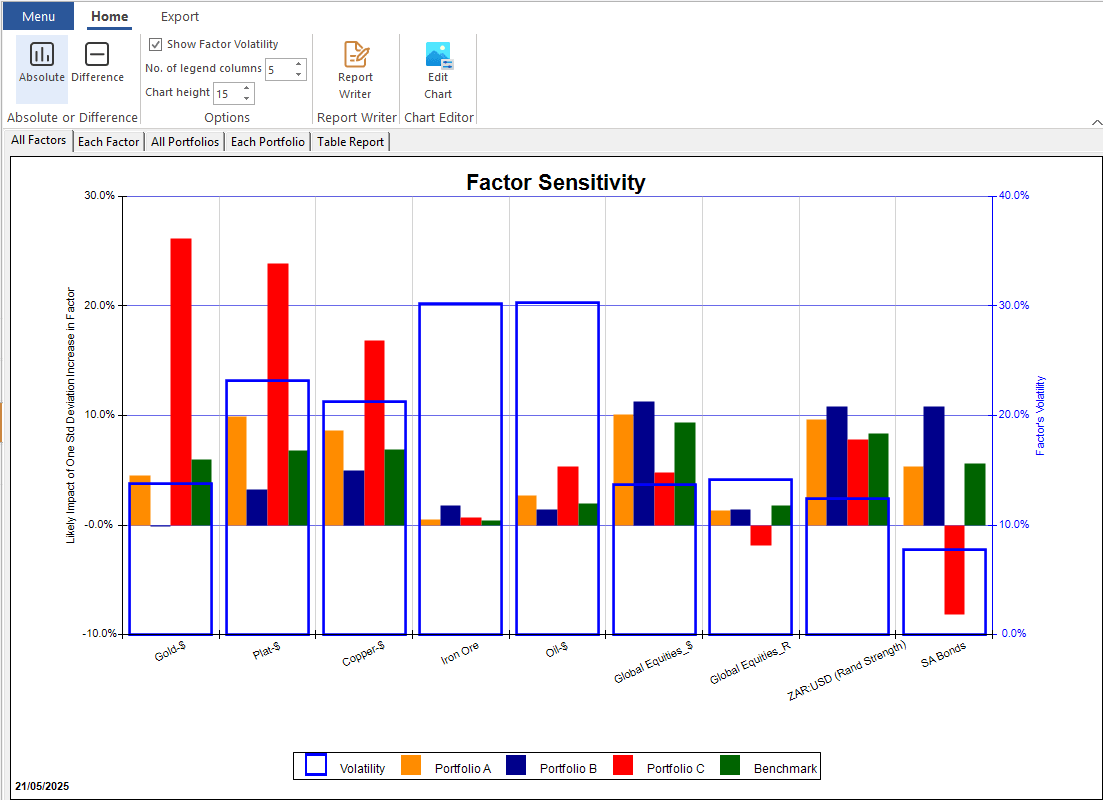
Assess how your portfolio is likely to respond to changes in customisable factors and identify potential vulnerabilities. By testing sensitivities to chosen market factors, teams can understand which exposures matter most, anticipate how portfolios may behave under different scenarios, and reduce surprises during market shifts.

Trade Modelling

Test hypothetical trades and see how changes affect portfolio risk, positioning, and exposure before executing decisions. This supports
a more disciplined investment process by allowing teams to review potential outcomes, validate trade intent, and understand how each adjustment changes the overall shape of the portfolio. Teams can compare different options and choose the path that best aligns
with mandate and risk objectives.

Test hypothetical trades and see their likely impact on your portfolio’s risk profile. For example, explore how your portfolio’s risk statistics and positioning would change if you used cash to purchase platinum shares. This feature helps you evaluate potential decisions before executing them.

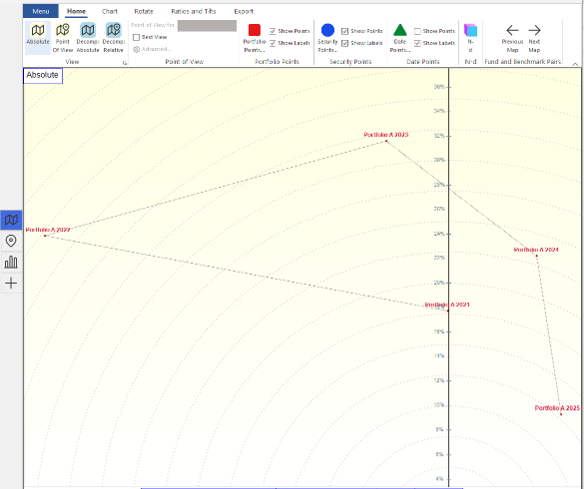
Watch your portfolio map update instantly after trade modelling. Changes in positioning, exposure, and concentration are highlighted visually, making it easy to see the impact of each trade at a glance. This makes scenario testing faster and more intuitive.

Automate rebalancing, align portfolios to targets, incorporate flows, and generate detailed trade reports. Advanced tools to support teams moving from analysis to implementation, enabling portfolio maintenance, target alignment, and flow management in one system. Trade reporting can be structured to support internal controls, validation processes, and clearer communication around trade decisions.

Trade Modelling

Tailored Reporting

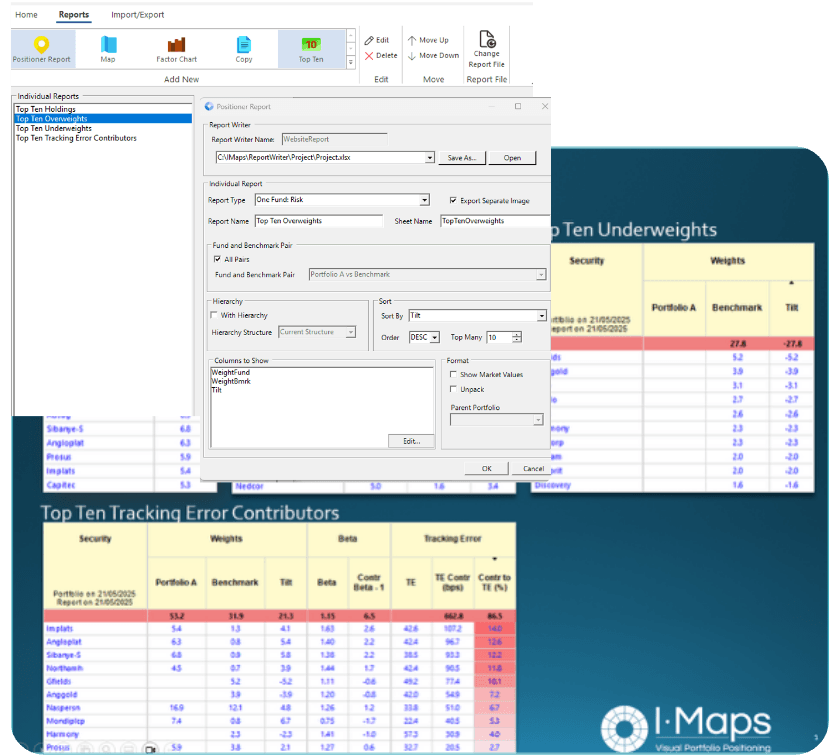
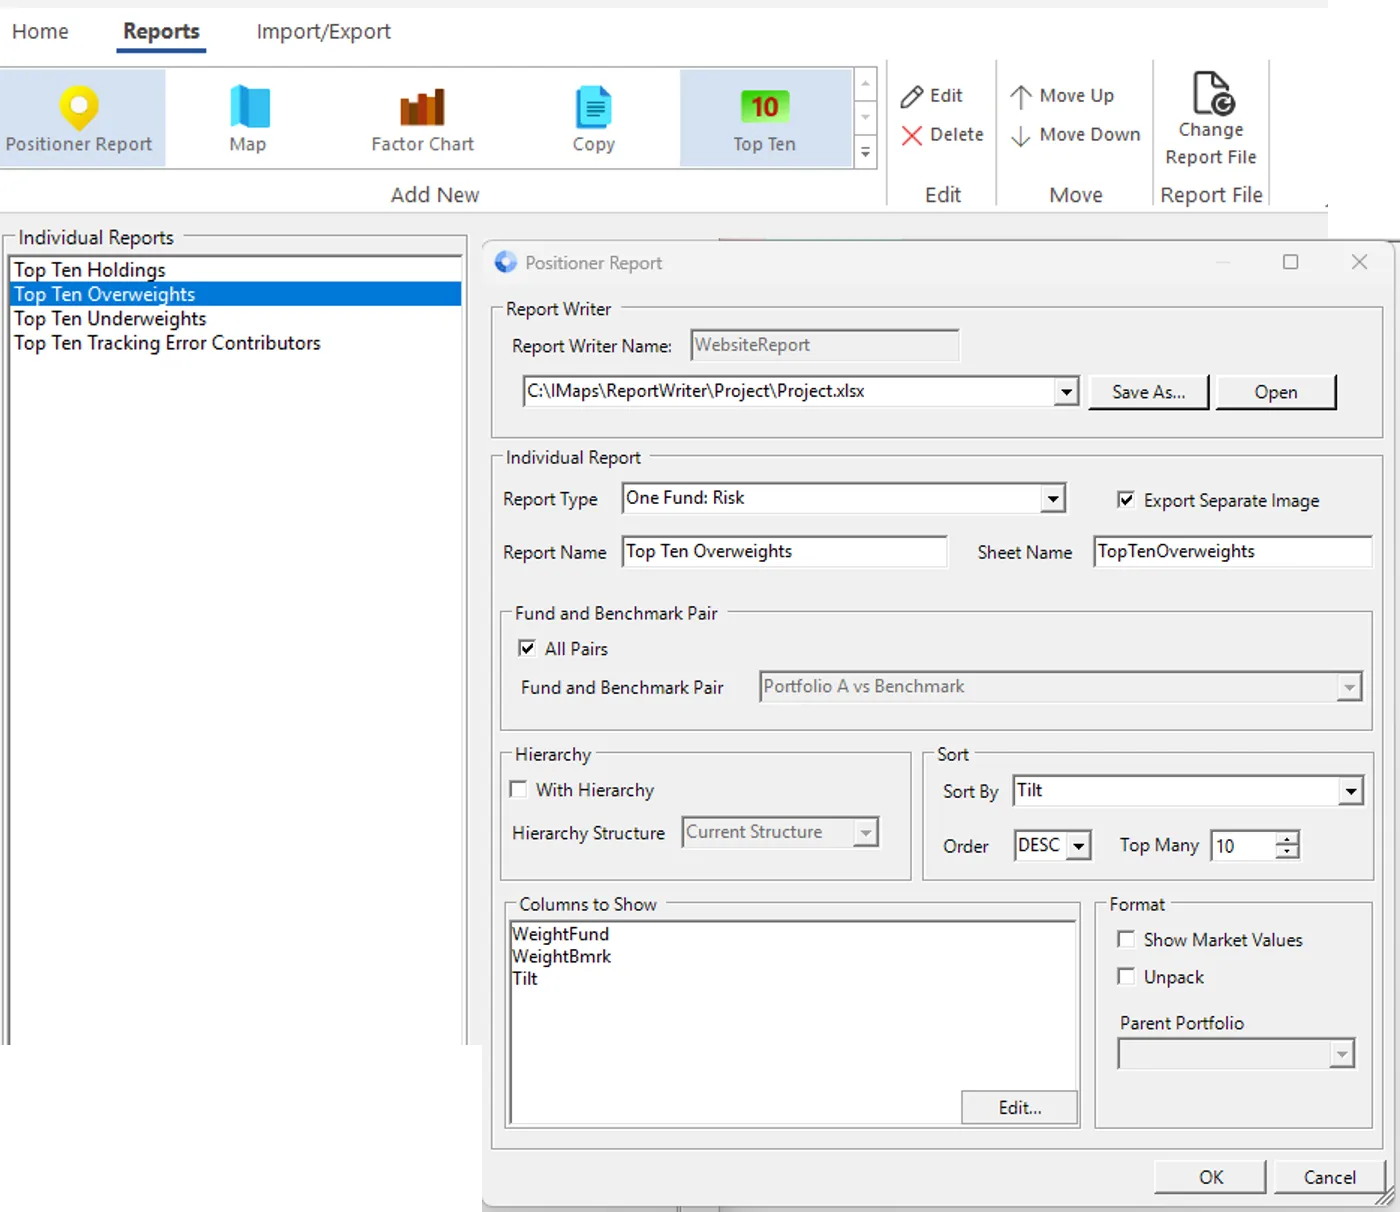
Create custom automatable reports that combine maps, analytics, and historical insights into a single, clear narrative. The report writer tool enables the automation and customisation of all I-Maps reports to and can be adapted to different audiences. This allows investment teams to produce governance-ready documentation and client-facing summaries quickly and accurately.

Build comprehensive reports designed around your specific needs. Include maps, portfolio comparisons, contribution tables, historical analyses, and factor charts — all within a single, cohesive report. These reports make it easy to communicate insights clearly with both internal teams and clients.
Our team offers face-to-face reporting sessions to help translate complex data into clear, actionable insight. These sessions support stronger alignment between stakeholders by turning analytics into a shared understanding of portfolio structure, active decisions, and risk drivers. This can strengthen decision-making and improve how insights are communicated to both internal and external audiences.

Explore trends, test strategies, and understand how portfolios have evolved over time. Historical tools such as Signature reports and the Backdater support deeper research and review by showing how positioning and risk changes have played out across different periods. This helps teams refine processes, validate assumptions, and strengthen decision-making with real historical evidence.

Custom Development

We work directly with your team to develop and integrate the features you need — whether that is custom trading tools, bespoke reports, integrated record-keeping, or tailored data formatting. The result is a platform that fits naturally into how your team already works, rather than asking you to change your processes to fit the software.

Custom solutions can include:

  • Specialized trading and modelling tools
  • Bespoke report formats and automated outputs
  • Integrated logs, audit trails, and record-keeping processes
  • Custom data handling, transformation, and formatting pipelines

Expert Support
and Consultations

Access ongoing expert support and personalised guidance to help you get maximum value from I-Maps and your portfolio data. From onboarding and training to advanced use cases, our team helps you interpret results, refine inputs, and get more insight from every tool. This support ensures I-Maps becomes a practical part of your decision-making routine, not just a standalone system.

Get up and running quickly with structured onboarding tailored to your team’s workflows, data sources, and objectives. We make sure your setup is right from day one.

Access our team of I-Maps specialists whenever you need strategic or technical support. Whether it’s interpreting results, refining data inputs, or exploring new features, our experts are available to ensure your experience runs smoothly. This continuous access means you’re never left guessing — help is always a conversation away.

Leverage our team’s extensive investment and analytics expertise to extract deeper value from your data. We help you uncover trends, highlight portfolio dynamics, and connect insights across tools and reports. With ongoing consultation, you’ll continuously refine how you use I-Maps — ensuring each capability contributes directly to better decisions.